K-Means Clustering
Learn how K-Means groups similar data points into clusters using iterative centroid updates
K-Means Clustering
Introduction
K-Means is one of the most popular and widely-used unsupervised learning algorithms for clustering. Unlike supervised learning where we have labeled data, clustering algorithms discover hidden patterns and group similar data points together without any prior labels.
K-Means is elegant in its simplicity: it partitions data into k distinct clusters by iteratively assigning points to the nearest cluster center and updating those centers. Despite its simplicity, it's remarkably effective for many real-world applications.
What You'll Learn
By the end of this module, you will:
- Understand how K-Means iteratively finds cluster centers
- Learn why initialization matters (K-Means++ vs random)
- Interpret clustering quality metrics (inertia, silhouette score)
- Recognize the impact of choosing different values of k
- Understand when K-Means works well and when it struggles
- Visualize how clusters evolve during the algorithm's iterations
What is Clustering?
Clustering is the task of grouping similar items together. It's an unsupervised learning problem because we don't have labels telling us which group each item belongs to - the algorithm must discover the groups on its own.
Real-World Examples
- Customer Segmentation: Group customers by purchasing behavior
- Image Compression: Reduce colors by clustering similar pixels
- Document Organization: Group similar documents or articles
- Anomaly Detection: Identify outliers that don't fit any cluster
- Gene Expression Analysis: Find groups of genes with similar behavior
- Market Research: Identify distinct market segments
The K-Means Algorithm
K-Means follows a simple iterative process:
 K-Means iteratively assigns points to clusters and updates centroids
Step 1: Choose K
Decide how many clusters (k) you want to find. This is a hyperparameter you must specify before running the algorithm.
Step 2: Initialize Centroids
Choose k initial cluster centers (centroids). This can be done:
- Randomly: Pick k random data points as initial centroids
- K-Means++: Use a smarter initialization (explained below)
Step 3: Assignment Step
Assign each data point to the nearest centroid. "Nearest" is typically measured using Euclidean distance:
distance = √[(x₁ - c₁)² + (x₂ - c₂)² + ...]
Where (x₁, x₂, ...) is the data point and (c₁, c₂, ...) is the centroid.
Step 4: Update Step
Recalculate each centroid as the mean (average) of all points assigned to that cluster:
new_centroid = mean of all points in cluster
For example, if cluster 1 contains points (1,2), (2,3), and (3,4):
new_centroid = ((1+2+3)/3, (2+3+4)/3) = (2, 3)
Step 5: Check Convergence
Check if the centroids have stopped moving (or moved less than a small threshold). If yes, stop. If no, go back to Step 3.
Step 6: Repeat
Continue the assignment and update steps until convergence or until reaching the maximum number of iterations.
K-Means++ Initialization
Standard random initialization can lead to poor results because:
- Random centroids might all be close together
- Some regions of data might not have any initial centroids
- The algorithm might converge to a suboptimal solution
K-Means++ solves this with a smarter initialization:
- Choose the first centroid randomly from the data points
- For each remaining centroid:
- Calculate the distance from each point to its nearest existing centroid
- Choose the next centroid with probability proportional to distance²
- This favors points that are far from existing centroids
This spreads out the initial centroids, leading to:
- Faster convergence
- Better final clustering
- More consistent results
Convergence
The algorithm stops when one of these conditions is met:
Centroid Stability
Centroids stop moving (or move less than a tolerance threshold):
max_centroid_shift < tolerance
This means the clusters have stabilized and further iterations won't improve them.
Maximum Iterations
A maximum number of iterations is reached. This prevents the algorithm from running forever if it doesn't converge.
Typical values: 100-300 iterations
Clustering Quality Metrics
 Silhouette plot showing cluster quality and separation
Inertia (Within-Cluster Sum of Squares)
Inertia measures how tightly grouped the clusters are:
Inertia = Σ (distance from each point to its centroid)²
Interpretation:
- Lower is better: Points are closer to their centroids
- Always decreases as k increases
- Not comparable across different datasets
Inertia alone isn't enough to evaluate clustering quality because it always improves with more clusters. With k = n (number of points), inertia would be 0!
Silhouette Score
The silhouette score measures how similar each point is to its own cluster compared to other clusters:
For each point:
  a = mean distance to other points in same cluster
  b = mean distance to points in nearest other cluster
  silhouette = (b - a) / max(a, b)
Interpretation:
- Range: -1 to +1
- Close to +1: Point is well-matched to its cluster and far from others
- Close to 0: Point is on the border between clusters
- Negative: Point might be in the wrong cluster
Average silhouette score across all points indicates overall clustering quality:
- 0.7 to 1.0: Strong structure
- 0.5 to 0.7: Reasonable structure
- 0.25 to 0.5: Weak structure
- Below 0.25: No substantial structure
Cluster Sizes
The number of points in each cluster. Ideally, clusters should have reasonable sizes:
- Very small clusters might be outliers
- One huge cluster and tiny others suggests poor clustering
- Roughly balanced sizes often indicate good clustering (but not always!)
Choosing the Right K
Choosing k (the number of clusters) is one of the biggest challenges in K-Means. Here are some approaches:
 The elbow method helps identify the optimal number of clusters
The Elbow Method
- Run K-Means for different values of k (e.g., 2 to 10)
- Plot k vs inertia
- Look for the "elbow" - where inertia stops decreasing rapidly
- Choose the k at the elbow point
The elbow represents the point where adding more clusters doesn't significantly improve the clustering.
Silhouette Analysis
- Run K-Means for different values of k
- Calculate the average silhouette score for each k
- Choose the k with the highest silhouette score
This approach considers both cluster cohesion and separation.
Domain Knowledge
Sometimes you know how many clusters make sense:
- Customer segments: 3-5 groups (budget, mid-range, premium, etc.)
- Image compression: Based on desired compression ratio
- Document topics: Based on known categories
Gap Statistic
Compare the inertia of your clustering to that of random data. The optimal k maximizes the "gap" between your data's structure and random data.
When K-Means Works Well
 K-Means works best with spherical, well-separated clusters
K-Means performs best when:
Spherical Clusters
Clusters are roughly circular/spherical in shape. K-Means assumes clusters are convex and isotropic (same variance in all directions).
Similar Sizes
Clusters have similar numbers of points. K-Means tends to create equal-sized clusters even if the true clusters have different sizes.
Well-Separated
Clusters are clearly separated with little overlap. K-Means struggles with overlapping clusters.
Similar Density
Clusters have similar density (points per unit area). K-Means may split dense clusters or merge sparse ones.
Limitations and Challenges
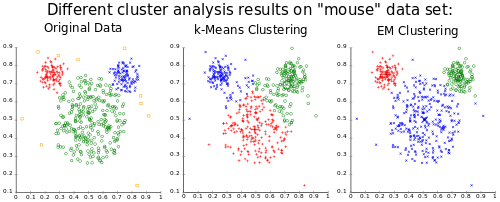
Non-Spherical Shapes
K-Means fails on:
- Elongated clusters: Elliptical or stretched shapes
- Concentric circles: Rings or nested structures
- Complex shapes: Moons, spirals, or irregular patterns
For these, consider DBSCAN, hierarchical clustering, or spectral clustering.
Sensitivity to Initialization
Despite K-Means++, different initializations can lead to different results. Solutions:
- Run multiple times with different random seeds
- Use K-Means++ initialization
- Choose the run with the lowest inertia
Sensitivity to Outliers
Outliers can significantly affect centroid positions. Solutions:
- Remove outliers before clustering
- Use more robust algorithms (K-Medoids, DBSCAN)
- Use larger k to isolate outliers in their own clusters
Must Specify K
You must choose k before running the algorithm. This requires:
- Domain knowledge
- Trial and error with different k values
- Using methods like the elbow method
Assumes Equal Variance
K-Means assumes all features have similar scales and variances. Solutions:
- Standardize features before clustering
- Use weighted distance metrics
- Consider other algorithms for features with very different scales
Computational Complexity
K-Means is efficient:
Time Complexity: O(n × k × i × d)
- n = number of points
- k = number of clusters
- i = number of iterations
- d = number of dimensions
Space Complexity: O(n × d + k × d)
This makes K-Means suitable for large datasets, especially compared to hierarchical clustering which is O(n³).
Variants of K-Means
Mini-Batch K-Means
Uses random samples (mini-batches) instead of all data in each iteration:
- Faster for large datasets
- Slightly less accurate but usually good enough
- More scalable to millions of points
K-Medoids (PAM)
Uses actual data points as cluster centers instead of means:
- More robust to outliers
- Works with any distance metric
- Slower than K-Means
Fuzzy C-Means
Allows points to belong to multiple clusters with different degrees:
- Soft clustering instead of hard assignments
- Better for overlapping clusters
- More complex to interpret
Tips for Better Results
1. Standardize Features
Scale all features to similar ranges:
# Standardization (z-score)
x_scaled = (x - mean) / std_dev
This prevents features with large values from dominating the distance calculation.
2. Remove Outliers
Identify and remove extreme outliers before clustering, as they can distort cluster centers.
3. Try Multiple K Values
Don't settle on the first k you try. Experiment with different values and use the elbow method or silhouette analysis.
4. Run Multiple Times
Run K-Means several times with different random seeds and choose the best result (lowest inertia).
5. Use K-Means++
Always use K-Means++ initialization instead of random initialization for more consistent results.
6. Visualize Results
Plot your clusters (in 2D or 3D) to visually inspect if they make sense. Use dimensionality reduction (PCA, t-SNE) for high-dimensional data.
7. Validate with Domain Knowledge
Check if the discovered clusters align with your understanding of the data. Clustering is exploratory - the algorithm doesn't know what makes sense in your domain.
Real-World Applications
Customer Segmentation
Group customers by:
- Purchase history
- Demographics
- Browsing behavior
- Engagement patterns
Use clusters to:
- Personalize marketing
- Recommend products
- Optimize pricing
- Improve retention
Image Compression
Reduce the number of colors in an image:
- Treat each pixel as a point in RGB space
- Cluster pixels into k colors
- Replace each pixel with its cluster center color
- Achieve compression by storing only k colors + assignments
Document Clustering
Group similar documents:
- News articles by topic
- Research papers by field
- Customer reviews by sentiment
- Emails by category
Anomaly Detection
Identify unusual patterns:
- Points far from all centroids are anomalies
- Very small clusters might represent unusual behavior
- Useful for fraud detection, quality control, network security
Recommendation Systems
Find similar users or items:
- Cluster users by preferences
- Recommend items popular in the user's cluster
- Cluster items by features
- Suggest similar items from the same cluster
Genomics
Analyze gene expression data:
- Cluster genes with similar expression patterns
- Identify gene functions
- Discover disease subtypes
- Understand biological processes
Summary
K-Means clustering is a powerful yet simple algorithm that:
- Groups similar data points into k clusters
- Uses iterative assignment and update steps
- Works best with spherical, well-separated clusters
- Requires choosing k beforehand
- Benefits greatly from K-Means++ initialization
- Is fast and scalable to large datasets
Understanding K-Means provides a foundation for:
- Other clustering algorithms
- Unsupervised learning concepts
- Data exploration and pattern discovery
- Feature engineering for supervised learning
Next Steps
After mastering K-Means, you can explore:
- Hierarchical Clustering: Build a tree of clusters
- DBSCAN: Density-based clustering for arbitrary shapes
- Gaussian Mixture Models: Probabilistic clustering
- Spectral Clustering: For complex cluster shapes
- Dimensionality Reduction: PCA, t-SNE for visualization
- Cluster Validation: Advanced metrics and techniques